Tuesday, July 5, 2011

Know The Fundamentals of Gold & Silver Investments

You can get regular updates on the fundamentals of gold & silver investments here.


Sunday, August 29, 2010

BUY GOLD NOW


I get this question a lot: "Should I buy gold now, or wait for a pullback?" 

It’s a valid question. For nearly two years, gold hasn't had a serious decline. There have been pullbacks, of course, but nothing assumption-challenging. In fact, since October 2008, gold’s largest price drop is 10.6% (based on London PM fix prices), and yet the average of all declines since 2001 is 13% (of those greater than 5%). The biggest pullback we've seen this summer is 8.2%. Technically the summer's not over, but I'll admit I'm surprised we haven't had a better buying opportunity. 

So, is now the time to buy? It depends on your honest answer to another question: “Do you own enough gold?” By “enough” I mean an amount that lends meaningful protection on your assets. By ”meaningful” I mean that no matter what happens next – another financial blow-up, accelerating inflation, crushing deflation, war, a plummeting dollar, more reckless government spending – you won't worry about your investments.

Whether you should buy now is almost irrelevant if you don't already own a meaningful amount of gold. If you earn $50,000 a year, how is one gold Eagle coin going to protect you if the dollar plummets and sends inflation soaring? If your investable assets total $100,000, is your nest egg sufficiently protected owning two gold Maple Leafs? This is all akin to buying a $50,000 insurance policy for a $500,000 home.

Today we face the prospect of prolonged economic stagnation, and most governments are administering grossly abusive monetary policy as a remedy. While some of the consequences are already being felt, the full ramifications have not hit your wallet yet. But they will.

If you don't have at least 10% of your investable assets in physical gold, or at least two months of living expenses, you have your answer: Buy. Don't use leverage, don't borrow money, and don't buy with reckless abandon, but yes, get your asset insurance policy and tuck it away. And then start working toward 20% (we recommend a third of assets be in various forms of gold in Casey's Gold & Resource Report).

Back to the original question: should we buy now, or wait for a pullback?

The answer comes when you look at the big picture. If you pull up a 9-year chart of gold, what sticks out is that the price is near its all-time nominal high. One could be forgiven for thinking it looks toppy or at least ripe for a pullback. But I assert that the highs for gold have yet to be charted.

What will a gold chart look like after adding five years to it?

When projecting gold's potential price peak, there are many ways to measure it. Conservatively, gold reaching its inflation-adjusted 1980 high would have it topping around $2,400 an ounce. More radically, if the U.S. tried to cover its cumulative foreign trade deficit with its current gold holdings, gold would need to hit about $32,000/oz.

Let's take something more middle of the road, and apply the same trough-to-peak percentage advance gold underwent in the 1970s. (I think there's a greater than 50/50 chance it does more than that, given the precarious nature of the U.S. dollar.) Gold rose from $35 in 1970 to $850 in 1980, a factor of 24.28. Our price bottomed in 2001 at $255.95; multiply that by 24.28 and you get a gold price of $6,214 per ounce.

Sound too high? Well, would it feel high if you had to pay $12.50 for a Big Mac? At $3.39 today at my local McDonald's, that's about what it would cost ten years from now if we get the same rate of inflation we had in the late 1970s.

So if gold hits $6,214, what might it look like on a chart if you bought today around $1,200?

$1,200 doesn't seem so pricey, does it?

I'm not saying there won't be pullbacks or that you shouldn't try to buy at lower prices. Just keep a big-picture perspective. Let's say gold falls to $1,100 and you're kicking yourself for having bought at $1,200… if gold reaches $6,200 an ounce, the profit difference between buying at $1,200 and buying at $1,100 is only 1.6%. If gold gets whacked to $1,000 (at which point I’ll be buying with both hands) the difference is still only 3.2%.

Heck, even if gold peaks at $2,400, you still get a double from current levels. (But unless government monetary policies immediately reverse course, gold isn't stopping at $2,400.)

So there's my answer. Yes, you have to accept my projection of gold's ultimate price plateau. And you have to sell at some point to realize the profit. But if the final chapter of this bull market looks anything like the chart above, I don't think you'll be too upset having bought at $1,200.

Carpe gold.

Sunday, January 17, 2010

Gold to Reach $5,000/oz by 2012

Jan. 12 (Bloomberg) -- Robert McEwen, chairman and chief executive officer of U.S. Gold Corp., talks with Bloomberg's Erik Schatzker and Deirdre Bolton about the outlook for gold prices. McEwen expects gold prices to increase to $5,000 an ounce between 2012 and 2014 as rising U.S. government debt depreciates the value of the dollar.

Friday, January 15, 2010

The skyrocketing U.S. debt has implications for all asset classes.

“If you establish a democracy, you must in due time reap the fruits of a democracy. You will in due season have great impatience of the public burdens, combined in due season with great increase of the public expenditure. You will in due season have wars entered into from passion and not from reason; and you will in due season submit to peace ignominiously sought and ignominiously obtained, which will diminish your authority and perhaps endanger your independence. You will in due season find your property is less valuable, and your freedom less complete.” --Benjamin Disraeli

Keith McCullough has tightened up his hockey hair this morning and will be appearing on Bloomberg TV as co-anchor; as a result I’ve been handed duties as lead author of the Early Look.

I was recently in Colorado visiting some old friends and had the opportunity to stay in their beautiful home with a mountain view, situated halfway between Vail and Aspen. Everything about their home, and life for that matter, is quite post-card perfect, including a cute puppy named Riggs, except for one thing: their house. Through no fault of their own, it has a less than stable foundation. This unstable foundation is leading to premature cracks in the walls. In many respects, I think it is the perfect analogy to the U.S. economy.

Any economy, or company for that matter, is only as solid as its balance sheet, which is equivalent to the foundation of a house. As a balance sheet’s debt ratios increase, the very foundation of the economy or company begins to crack. We’ve recently handed the responsibility of surveying sovereign debt loads to Darius Dale, a recent Yale grad who joined our team about six months ago. Every morning Darius e-mails, by 6:30 a.m., Darius’ Debt Download. After reviewing these reports for the last week, there is an obvious conclusion: The economic foundation of the United States is crumbling.

I discussed this in some detail to our subscribers yesterday in a note, but wanted to replay the key facts this morning. These are facts that every investor of every asset class needs to keep front and center. They are as follows:

--Total current U.S. national debt: $12.17 trillion;

--Total current U.S. national debt per taxpayer: $111,622

--Debt to GDP ratio: 83.5%

These numbers are subject to some debate, and we have sourced them from Usdebtclock.org and government data. Setting aside specific debate on the precise numbers, the irrefutable point remains: The U.S. National Debt is massive and expanding. The key components of this debt are as follows:

--Medicare and Medicaid: 21.9%;

--Social Security: 19.2%

--Defense and wars: 19.1%

U.S. National debt as a percentage of GDP has been climbing steadily since 2000 and has seen exponential growth in the last two years. At the current ratio of 83.5% debt to GDP, we are at a level not seen since the 1950s. In lieu of our ETF portfolio this morning, we have outlined this metric in the chart below going back 90 years. By the end of 2010, this ratio is projected to be near 100% of GDP absent a dramatic shift in domestic budgetary policy. As with any borrowing, the more a person, entity or company borrows, even the United States of America, the higher their cost of borrowing will go, all else being equal.

Interestingly, the national debt of $12.17 trillion actually excludes Fannie Mae ( FNM - news - people ) and Freddie Mac ( FRE - news - people ) debt. The U.S. government became the effective conservator of both of these entities with the Housing and Economic Recovery Act of 2008. The estimated combined on and off balance sheet debt of Fannie and Freddie is purported to be just over $5 trillion. Including this additional $5 trillion in debt, U.S. Government debt as a percentage of GDP is actually more than 120%. On that basis, U.S. government debt as a percentage of GDP is the highest ratio it has ever been, or at least since the numbers were first recorded in 1792.

Globally, this data hasn’t been updated since 2008, but based on the latest data, the U.S. has the fifth-highest indebtedness as a percentage of GDP, barely above Singapore and just below Jamaica. The only other countries more indebted than the U.S., on this basis, are the economic stalwarts of Zimbabwe, Japan and Lebanon.

Keep your eyes on U.S. government debt . . . this Queen Mary is not turning any time soon and will hold investment implications related to many asset classes for years to come. We cannot increase our debt exponentially without increasing our borrowing costs.

Setting aside investment considerations, there are also implications for a nation's very freedom and prosperity as former British Prime Minister Benjamin Disraeli states above. Specifically, even if it had to, the U.S. couldn’t afford to fight another large-scale ground war. The only positive from this situation is that the government may be constrained from implementing policy “from passion and not from reason." And that, at the end of the day, is a good thing.

Monday, January 11, 2010

7 Reasons Gold Will Surpass $2,500 - And Inflation Isn’t One of Them

Gold’s price has quadrupled since 2000, yet this is just the beginning of a historic rise.  Seven major forces are set to push gold past $2,500 – and we’re not talking about the tired old inflation story…

We’ve all heard that inflation drives up gold prices.  When inflation is on the rise, investors buy more gold to hedge their portfolios.

And, with all the government bailouts and stimulus packages, it’s hard to deny that inflation is coming.  After all, the money supply has more than doubled since October.

Yet few people realize that inflation may be the least of the reasons why gold prices will push higher.

Since bottoming out in 2001, gold prices have risen by nearly 300% and is now trading above the $1,100.  And that’s happened in a relatively “inflation-free zone.”

There are other forces at work here.  This report will show you exactly why inflation is only a small part of the gold story.  And, we’ll identify the best ways to profit from the coming gold rush.

Gold Trend #1Gold Mine Production is Decreasing.
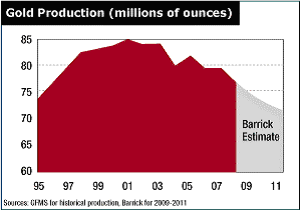
Annual worldwide mine production of gold has decreased by 9.3% since 2001.  Considering gold prices have nearly quadrupled since then, why isn’t more gold being produced?  The answer is simple.  Resources are being depleted and their quality is diminishing. And, when a discovery is made, it takes about 7-10 years to get a mine permitted and into production – making it difficult to quickly ramp up gold production.


Gold Trend #2: Gold is Getting Harder to Find.
Fewer and fewer large gold discoveries are being made every year. And the discoveries that are being made tend to be in more remote and less geopolitically attractive areas.  Considering that the risks to opening any gold mine are considerable, mining companies just aren’t interested in mining in areas that have significant political and geographical drawbacks.  As a result, miners are having difficulty replacing depleted resources.


Gold Trend #3: Investment Demand for Gold.
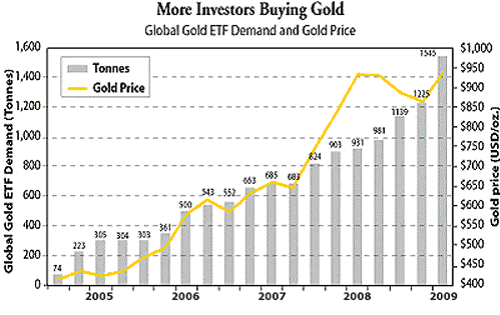
Large institutional investors, such as hedge and pension funds, are making large allocations to gold and gold shares. Individual investors are also getting in on the action, with gold exchange-traded funds (ETFs) gaining influence. SPDR Gold Trust (NYSE: GLD), the largest physically backed ETF on the planet, is now the 6th biggest holder of gold bullion with more than 1000 tons. That is helping to facilitate and spread the ownership of gold by individuals.  In fact, in the first half of 2009 investment demand for gold is up 150% over the first half of 2008, according to the World Gold Council.


Gold Trend #4: Central Banks are Buying Gold.
The Central Bank Gold Agreement, originally signed in 2001 and recently renewed for another five years, limits the amount of gold European central banks – including the International Monetary Fund – can sell to 400 tons per year.  This means that even if governments want to sell off their gold reserves, they can’t  – further straining the supply of gold on the market. The U.S., the world’s largest holder of gold, is holding on to their stash as well.  Some governments are going even further: Venezuela’s Finance Ministry now requires 70% of gold produced in the country to be sold domestically. At the same time, Russia, Ecuador, Mexico and the Philippines are all buying gold.  And China has increased its reserves by a staggering 76%.

Gold Trend #5: Push for Gold-backed Currencies.
As investors the world over lose faith in their government’s ability to contain the financial and economic crises, many are calling for gold backed currencies – much like the U.S. dollar was until the early 1970’s.  Even Zimbabwe, which a year ago had hyperinflation running at 231 million percent annually, is now considering reintroducing its Zimbabwe dollar, but this time fully backed by assets, including gold.  In order for this to happen, countries would have to purchase enough gold to back all their currency – putting extreme pressure on the gold supply.

BUY GOLD PRODUCTS


Gold Trend #6: Asian Demand for Gold is Exploding.
Asia, with its more than two and a half billion people, has a major impact on investment demand.  Asians have a long-standing cultural affinity for gold as a store of wealth.  India is the world’s largest gold consumer.  For the last 50 years, until 2009, the Chinese government has forbidden its citizens from owning gold.  But now China is encouraging its citizens to buy silver – which automatically draws more attention to gold.  Today, Chinese investors even have access to gold-linked checking accounts. As a result, demand for gold in mainland China is expected to triple in the next few years.


Gold Trend #7:  Gold is in a Secular Bull Market.


Gold’s price has increased every single year since 2001.  This is a clear signal that we are currently in the middle of a secular bull market for gold.  A secular bull market typically last about 17 years and ends with a mania stage where investors throw the concept of supply and demand out the window and frantically invest in gold.  We’ve seen this same pattern repeat itself over the last hundred years of investment history and we’re about to see a major run up in gold prices.  The gold market is very small in relation to the currency, bond or stock markets, so when investors start to pile in, look out.  Prices will go through the roof – making the tech and housing bubbles seem small in comparison.


Friday, January 1, 2010

Outlook for Gold - 2010

By David Lew
What is the real reason behind the historic rise in gold prices? Futures and spot prices of gold across global commodity bourses and bullion markets have been surging for the past few months. Gold price touched a high of $1195 per ounce in the last week of November.

Bullion analysts have been maintaining that depreciating US dollar is one main reason for the big rise in gold prices. Now, global commodities investment guru Jim Rogers says budget deficits in many countries across the world are propping up gold prices.

Is it true? Jim Rogers has forecast that gold prices would zoom to a record $2000 per ounce in the next decade, beginning next year. Rogers, who has been aggressively investing in agricultural commodities, especially in China, has also recently maintained that given a chance to invest in bullion, he would put his money in silver and palladium, and not in gold, as the yellow metal prices are on fire.

But is budgetary deficits spurring gold, and bullion trade in into the high-price tag level?

Here is what Jim Rogers told Business Week:

“Gold’s recent price surge is thanks to budget deficits. “Deficits are going berserk nearly everywhere. Throughout history, printing money has led to weaker currencies and higher prices for real assets.”

“here are many, many pessimists about the dollar, including me. So many pessimists that I suspect there's a rally coming.”

“I have no idea why there should be, but things do usually rally when you have this many bears at the same time. I've actually accumulated a few more dollars.”


There is sense in what Jim Rogers is saying. He should know, as some of his best known books like Adventure Capitalist, Investment Biker, A Bull in China, and Hot Commodities have been eye-opening to the world economy, commodities market and investment ideas.

Budget deficits are ballooning in most of the countries across the world. Global leader United States is hard hit by budgetary deficits; so are countries like Britain, India, Brazil, Russia, South Africa. In fact, the city state of Dubai, that has been proclaimed as the epicentre of modern development is under severe strain these days, thanks to a serious debt crisis.

Dubai, one of the major gold trading centres in the world, along with Mumbai and Beijing, is today going through a major credit default fear. Many say gold price will boom or doom thanks to the credit bubble repercussions in Dubai.

One best example for budget deficit is Britain. British government has been hit hard by budgetary deficits that the country’s finances are said to be in a tight spot.

Read a recent Times Online report on Britain’s precarious economy:

“Britain’s threadbare public finances were thrown back into the spotlight today as it was revealed the Government was forced to borrow £11.4 billion in October to meet its bills - the worst figure for the month since records began in 1946.

Tax receipts collapsed by £4.1 billion compared with October 2008 while spending was £4.5 billion greater as the recession took its toll on corporate profits and consumer spending while welfare payments surged.

Total public sector net debt grew to £829.7 billion, equivalent to 59.2 per cent of total national output, by the end of October. That compares to £695.1 billion and 48.6 per cent a year earlier.” 


It is unlikely that countries like Britain will be able to bring down the budgetary deficit in the near future. So will gold price continue to flourish to the record $2000 per ounce, as predicted by Jim Rogers? Let us wait and watch.

David Lew is a bullion commentator with Commodity Online.

Tuesday, December 29, 2009

Gold Investment - Public Gold Products

Public Gold products are priced at the daily gold market rate. The price is quoted daily and pegged to the international gold price to facilitate buying and selling.

Public Gold products can be purchased  individually or as a set. It is easy to buy, sell and store.
Public Gold Gold Bullion Bar are available at 20 gram, 50 gram, 100 gram and 1 kilogram. The Public Gold Gold Coin can be purchased at 50 gram.

The weight and purity of Public Gold coins are precisely controlled and standardised by an internationally recognised refiner and mint, allowing you to buy with confidence and sell with ease.

When is the right time to buy? Is now the right time to buy?
The answer is always YES! Gold is a long term investment.

The right time to buy Public Gold products is when you understand what it is and what it can do for your portfolio.

For further information and enquiries, please contact us at +6 017  873 6975